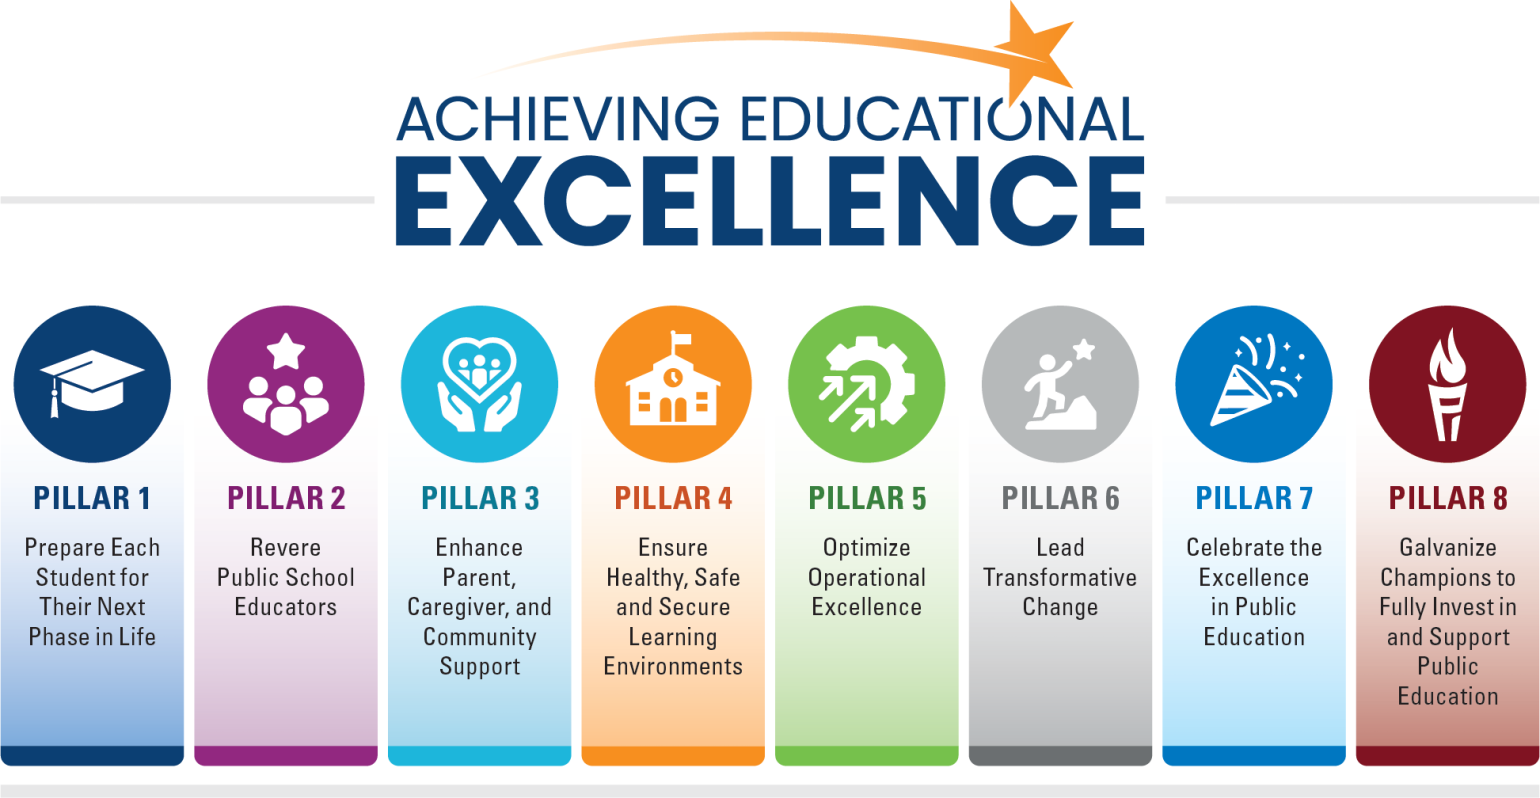
North Carolina’s Achieving Educational Excellence Strategic Plan emphasizes healthy, safe, and secure learning environments. Specifically, Pillar 4 calls for specific action to identify and share effective practices for reducing chronic absenteeism and strengthening student attendance. AttendNC Counts is intended to respond to that charge by creating a clearer pathway from local attendance improvement efforts to statewide learning, support, and action.
Project Overview
AttendNC (“Attendance”) Counts is a statewide, research-to-practice initiative that brings together researchers, practitioners, and policy leaders to elevate promising attendance practices, amplify them through coordinated communications, and strengthen data-enabled routines so schools and districts can act earlier and more effectively.
AttendNC Counts organizes the state’s chronic absenteeism work into a single, coherent plan that connects:
- Bright Spots learning (what is working in real schools and why)
- Communications and recognition (consistent messages and shared wins)
- Impact and analytics (clear evidence on why attendance matters and where to focus)
- Data and reporting supports (tools that help teams identify risk and respond sooner)
- Policy and guidance alignment (shared definitions and more consistent responses)
Why AttendNC Counts
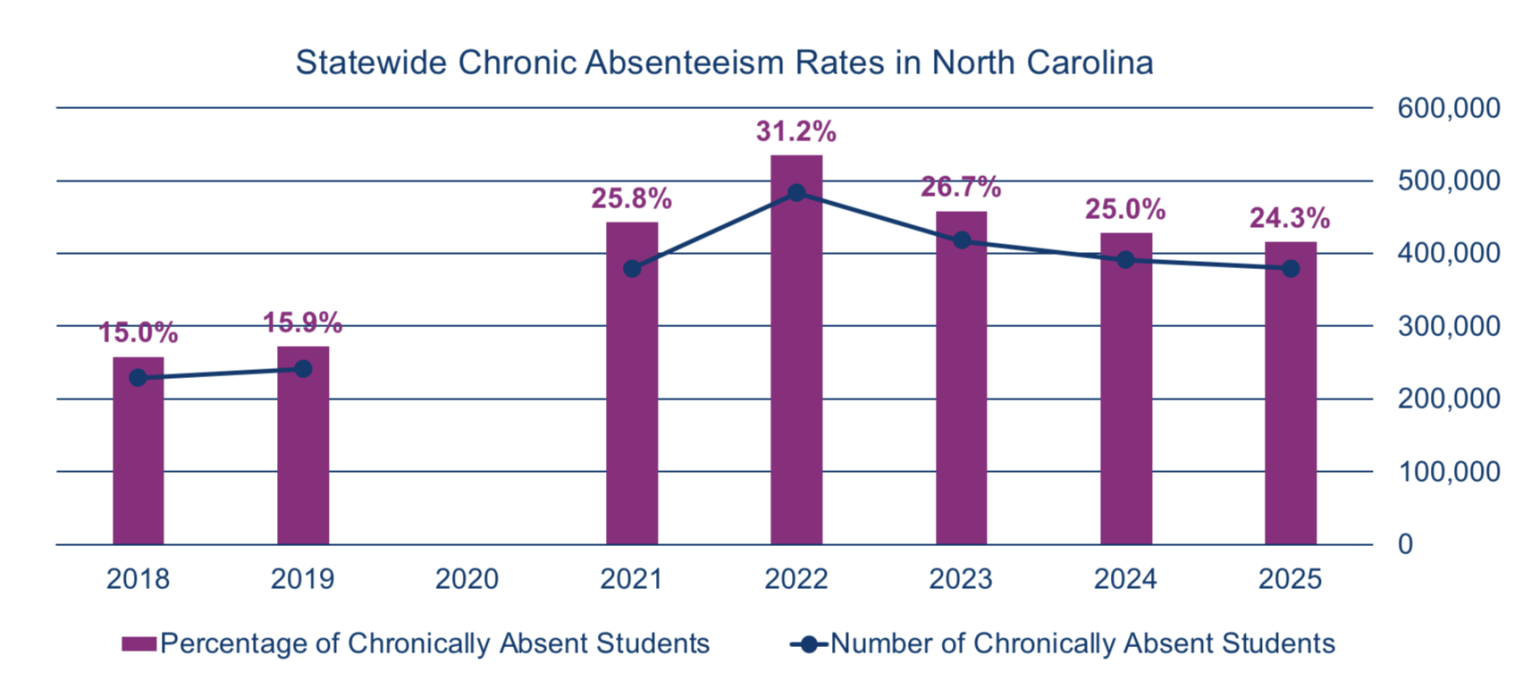
Chronic absenteeism (defined in North Carolina as missing 10% or more days of school) has emerged as a national educational crisis, with rates surging in the wake of the COVID-19 pandemic. In North Carolina, 24% of students, nearly 400,000, were chronically absent during the 2024–25 school year. The impact has been especially severe in high-poverty, rural, and urban districts. While chronic absenteeism rates in North Carolina have declined since their pandemic peak of 31%, and attendance bright spots can be found across the state, absenteeism levels in general remain well above pre-pandemic norms.
Missing 10% or more of instructional time creates significant learning challenges and can adversely affect student wellbeing. Research has repeatedly found that students who are chronically absent are at higher risk for:
- Lower achievement and slower skill growth, especially in early literacy and math foundations
- Course failure and credit accumulation problems in middle and high school
- Lower graduation rates and weaker postsecondary transitions
- Reduced engagement and belonging, which can further reinforce avoidance or disengagement
- Widening opportunity gaps, because chronic absence is often concentrated among students facing the greatest structural barriers
At the school level, high rates of chronic absenteeism are associated with weaker overall performance, greater instructional disruption, and increased workload for educators who spend time catching students up or responding to crises that could have been prevented earlier. Research also suggests there can be peer effects, meaning attendance patterns can spread within friendship networks or classrooms when disengagement becomes normalized
Goal & Objectives
AttendNC Counts aims to reduce statewide chronic absenteeism by improving how schools, districts, and the state:
- Build awareness and engagement, including an understanding of why attendance matters and elevating successful approaches through clear messaging and recognition.
- Support adoption of promising practices by Identifying and translating effective attendance routines into practical tools that other schools can use, especially within similar contexts.
- Improve reporting and early identification by strengthening analytics and reporting so teams can flag risk earlier and take timely action before absences accumulate.
- Increase consistency and equity of responses through shared definitions and expectations so supports are more consistent across PSUs and student groups
Key Activities
To advance these objectives, AttendNC Counts integrates five mutually reinforcing activity strands:
| Strand | Activity |
|---|---|
| 1. Bright-spot learning and practice supports |
|
| 2. Statewide communications and recognition |
|
| 3. Impact analyses and messaging tools |
|
| 4. SIS reporting and analytics |
|
| 5. Policy and guidance alignment |
|
Project Timeline & Measures
AttendNC Campaign and Bright-Spots Discovery
Q1 (Jan–Mar 2026): AttendNC Hub and Bright-Spot Identification
- Launch the AttendNC hub with initial tools and assets.
- Host webinars and publish campaign content.
- Run initial bright-spot identification analyses using 2024–25 attendance data.
- Release an “Impact at a Glance” product and other early visuals to support consistent messaging.
Q2 (Apr–Jun 2026): Schools Spotlight & PD Feasibility Study Prep
- Validate bright-spot candidates through interviews and focus groups.
- Expand the hub with bright-spot profiles and additional resources.
- Finalize school typology and “expected absence” models to strengthen comparisons within peer groups.
- Develop Positive Deviance (PD) recruitment materials and participation criteria (district, school, and partner roles).
- Define the SIS analytics specification, data dictionary, and pilot plan
Q3 (Jul–Sep 2026): SBE Brief, PD Kickoff, & SIS Specs
- Brief the State Board on early findings and highlights.
- Confirm Positive Deviance participating districts and schools, complete onboarding steps, and schedule the kickoff convening.
- Begin baseline fieldwork in participating sites, including initial visits, interviews, and documentation of current attendance routines, roles, and enabling conditions.
- Convene the Positive Deviance kickoff (September) and finalize the implementation learning plan, roles, and cadence.
- Prepare SIS pilot deployment (user provisioning, help docs, training materials).
Q4 (Oct–Dec 2026): PD Implementation & SIS Pilot Launch
- Launch PD Cycle 1 implementation supports, including action planning, team routines, and targeted outreach strategies aligned to local barriers.
- Continue and complete baseline fieldwork documentation and initial synthesis to inform Cycle 2 supports.
- Launch the SIS pilot with participating PSUs, including user provisioning, training, and an initial feedback cycle to refine dashboards and early-warning views.
- Implement a quality-control plan for analytics and communications assets.
Positive Deviance Implementation and SIS Pilot Execution
Q1 (Jan–Mar 2027): PD Cycle 2 Launch, Baseline Synthesis, & SIS Iteration
- Launch PD Cycle 2 implementation and monitoring routines in pilot schools, including action-plan refinement and documentation of adaptations.
- Use SIS pilot early-warning views to support timely Tier 1 and Tier 2 responses and to strengthen follow-through routines.
- Iterate SIS dashboards based on pilot usage and feedback, prioritizing usability, role-based access, and clarity of early-warning thresholds.
- Continue the Spotlight Series and publish hub updates aligned to winter and early spring attendance findings.
Q2 (Apr–Jun 2027): PD Cycle 2 Continuation, Practice Packaging, & SIS Refinement
- Continue Cycle 2 implementation supports and monitor fidelity and leading indicators (for example, outreach follow-through and routine completion).
- Synthesize Cycle 1–2 learning into transfer-ready routines and enabling conditions to support “schools like us” adoption.
- Refine SIS dashboards and early-warning thresholds using feedback from schools and districts, and publish short “how-to” implementation aids for teams.
- Maintain quarterly recognition and campaign content to reinforce momentum and spread strategies.
Q3 (Jul–Sep 2027): Cross-Cycle Synthesis, Adoption Supports, & SIS Expansion Readiness
- Onboard additional districts for the 2027–2028 expansion, including roles, timelines, and participation expectations.
- Refresh hub resources for back-to-school implementation, including updated templates, practice profiles, and training supports.
- Confirm SIS expansion readiness (data quality checks, access provisioning processes, and updated guidance aligned to statewide definitions).
- Update benchmarking and bright-spot identification routines using the most recent available data (as applicable).
Q4 (Oct–Dec 2027): Ongoing Monitoring (T1), Tool Refinement, & SIS Pilot Deepening
- Launch the 2027–2028 PD school-year cadence with pilot schools (repeatable routines, check-ins, and documentation), while initiating supports with the expanded Group 4 cohort.
- Produce an early-year monitoring update that captures implementation progress, early leading indicators, and what is being adapted across contexts.
- Expand SIS pilot supports to cover the broader 2027–2028 cohort, including training, user provisioning, and an initial feedback cycle to refine dashboards and early-warning views.
- Publish an end-of-calendar-year “what we’re learning” update and refine tools to support expansion in the second half of 2027–2028.
Scale-Up and Statewide Launch Readiness
Q1 (Jan–Mar 2028): PD Continuation, District Expansion, & SIS Stabilization
- Continue the 2027–2028 PD cadence across pilot schools and expanded district cohort, including coaching check-ins, monitoring routines, and documentation of adaptations.
- Synthesize midyear learning into refined, context-specific playbooks and “schools like us” adoption supports for new districts.
- Stabilize and improve SIS dashboards and early-warning views based on expanded-cohort feedback, including role-based supports and usability improvements.
- Publish updated practice profiles and tools aligned to common winter-to-spring attendance barriers.
Q2 (Apr–Jun 2028): Learning Synthesis, Toolkit Consolidation, & Statewide Launch Planning
- Complete end-of-year documentation and learning synthesis for the 2027–2028 cadence, including what routines were feasible, repeatable, and transferable.
- Consolidate tools into a Promising AttendNC Practices toolkit, including templates, meeting routines, outreach resources, and implementation guidance.
- Finalize the 2028–2029 statewide launch plan across all district typology groups, including onboarding approach, training supports, and communications cadence.
- Confirm SIS statewide enablement requirements (access processes, data quality checks, training materials, and support workflows).
Q3 (Jul–Sep 2028): Statewide Readiness, Onboarding Prep, & Back-to-School Launch Assets
- Prepare statewide onboarding materials for 2028–2029, including participation guidance, implementation routines, and role-based training resources.
- Publish back-to-school versions of the toolkit and hub resources, aligned to early-year attendance routines and messaging.
- Conduct statewide readiness steps for SIS expansion (provisioning processes, user training pathways, and documentation aligned to statewide definitions).
- Refresh the Spotlight Series plan and recognition workflow to support statewide participation in 2028–2029.
Q4 (Oct–Dec 2028): Statewide Launch, Early Monitoring, & Support Routines
- Launch the PD-inspired attendance improvement cadence statewide for the 2028–2029 school year across all district typology groups, using the refined toolkit and implementation supports.
- Establish early-year monitoring and feedback routines statewide, including leading indicators, participation metrics, and rapid-cycle tool refinement.
- Expand SIS dashboards and early-warning views for broader statewide use, supported by training refreshers and role-based job aids.
- Publish an early statewide “what we’re learning” update and highlight initial implementation examples through webinars and recognition features.
Measures of Progress and Successful of Implementation
- Attendance and Leading Indicators: Monthly/annual chronic rates, daily attendance, early-year flags, outreach success, typology peer comparisons; students exiting chronic status.
- Equity and Reach: Subgroup gaps, grade-span and rural/urban differences, spread of adoption.
Implementation Fidelity and Adoption: Fidelity checklists, action plans, adoption counts, exposure/duration, meeting notes. - User Engagement and Dissemination: Dashboard use, downloads, webinar attendance/ratings, TA requests and resolutions.
Perception and Climate: Staff, student, and caregiver surveys; targeted interviews/focus groups. - Milestones and Deliverables: On-time outputs (briefs, playbooks, webinars, comms), bright-spot stories documented.
Data to Support Implementing Project Activities
- Research and Literature Review: Compilation of national and state-level research on effective and innovative practices to reduce chronic absenteeism.
- Absenteeism Data: School-, district-, and state-level attendance data, including chronic absenteeism rates disaggregated by grade span, student subgroup, and instructional model.
- DPI Administrative Data: Enrollment, demographic, and school characteristic data to support typology development
Survey Data (UNC-CH): Principals, counselors and social workers' views on why students miss school, what attendance strategies they use, and what supports they need. (Survey Draft) - Bright-Spot Schools: A statewide list of bright-spot schools doing better than similar schools on chronic absenteeism, with recent trends and basic context to help identify promising attendance practices.
- Qualitative Data: Interviews and focus groups from bright-spot schools and PSUs to understand promising attendance practices likely contributing (or not) to improved attendance.
- Intervention Data: Implementation and impact data on locally implemented attendance and engagement strategies (e.g., early warning systems, attendance campaigns, tiered interventions).
- SIS Real-Time Analytics: Nightly refreshed reports the statewide SIS; metric definitions and calculation rules aligned with SBE policy and the Student Accounting Manual.
- Communications Assets & Analytics: Attendance hub content, blog/press items, webinar artifacts, family flyers, social toolkits, and basic campaign analytics (reach, downloads, registrations) to drive consistent statewide messaging.
Current Partners